When we hand over a new website, we set up analytics and show the client the dashboard. Six months later, most of them have never opened it again. And honestly, we understand. Analytics tools show hundreds of reports, and most of them don't help a business owner make any decision.
One client, who runs an interior design studio in Hyderabad, put it perfectly: "I don't want a dashboard, I want to know if the website is working." Fair enough. So we now give every client a much shorter list. Five numbers, once a month, about ten minutes. Here they are.
1. Enquiries or sales
This is the only number that really matters, and it's surprisingly often not tracked. Count contact form submissions, WhatsApp clicks, phone call clicks, quote requests or orders: whatever "a new customer reached out" means for you.
If your analytics doesn't track these as events or conversions, fix that first. Everything else on this list is there to explain why this number goes up or down.
2. Where visitors come from
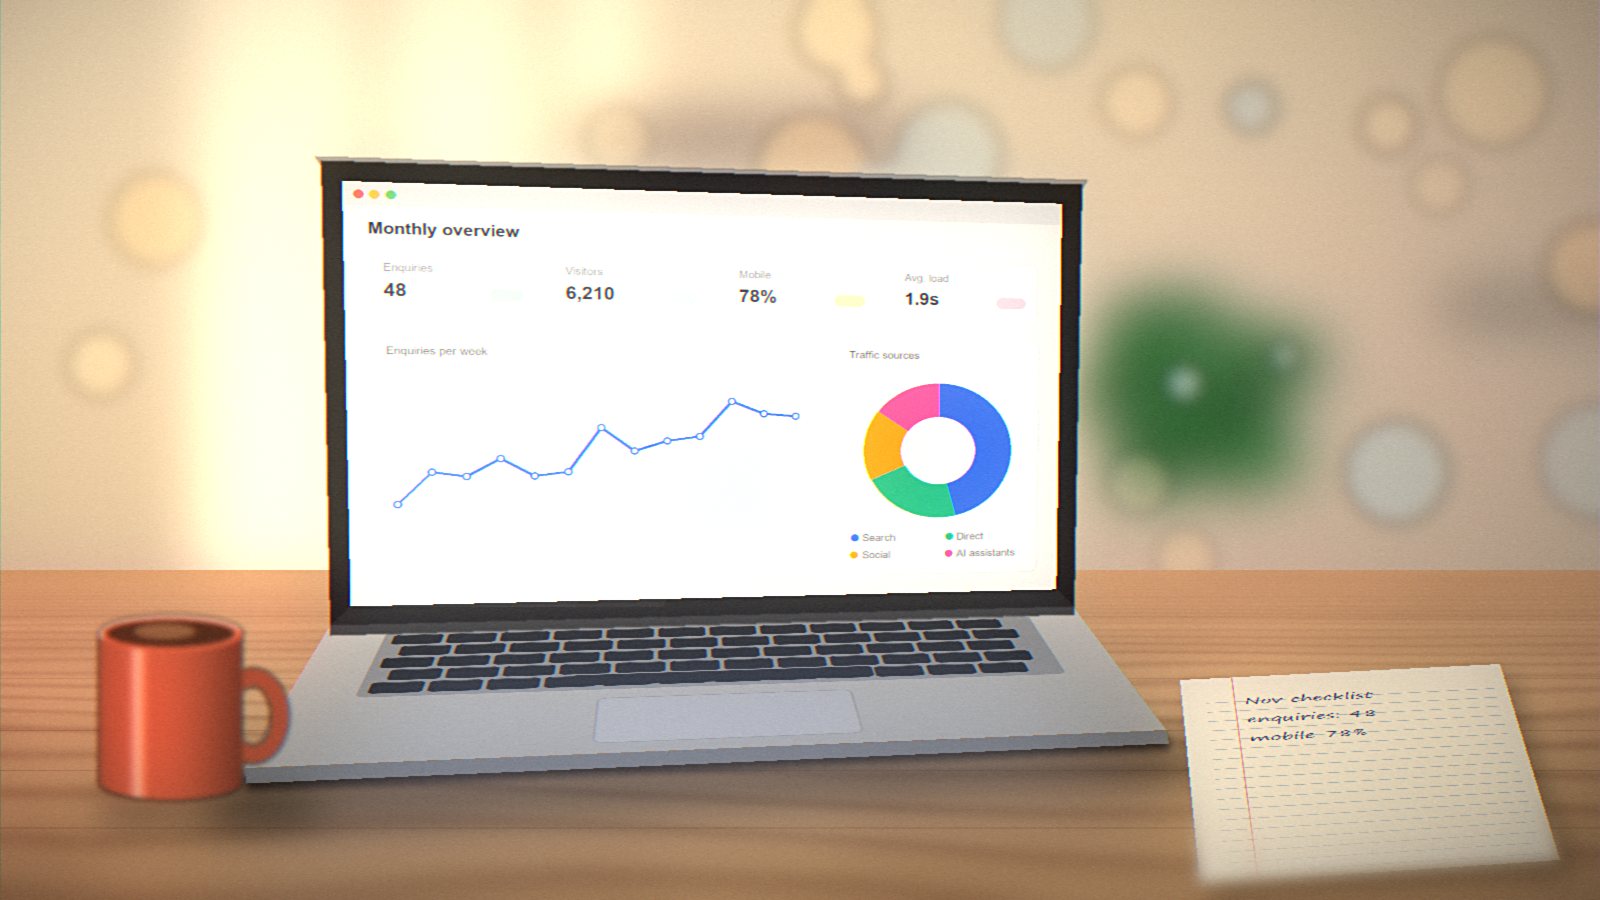
Look at your traffic split by channel: Google search, direct, social media, ads, referrals from other sites, and, increasingly, AI assistants. You don't need exact numbers. You're looking for changes. If search traffic drops by a third in a month, something happened: a Google update, a broken page, a competitor's new campaign.
3. Your top pages
Which ten pages get the most visits? Often there are surprises: an old blog post that still brings in hundreds of visitors, or a service page nobody finds. Make sure your top pages are up to date and have a clear next step, like a contact button or a link to a related service.
4. Mobile vs desktop
For most of our Indian clients, 70 to 85 percent of visitors are on phones. Compare the enquiry rate on mobile against desktop. If mobile visitors rarely convert, open your site on an ordinary mid-range phone with mobile data and try to send an enquiry yourself. You'll usually find the problem within five minutes. Last year, for one client, it was a "Get a quote" button that sat exactly under the WhatsApp chat bubble on smaller phones. On desktop, everything looked perfect. On a ₹12,000 Android phone, nobody could tap it.
5. Page speed on real devices
In Google Search Console, the Core Web Vitals report shows how fast your pages are for real visitors. You don't need to understand every metric. Just check whether pages are marked "Good", "Needs improvement" or "Poor", and whether that's changing. Slow pages lose visitors before they ever see your offer.
What to ignore
- Bounce rate on its own. Someone who finds your phone number and calls you has "bounced", and that's a success.
- Total page views. More isn't better if they're the wrong visitors.
- Daily ups and downs. Weekends, holidays and festivals all move traffic. Compare month to month, or this month against the same month last year.
Make it a habit
Put a recurring ten-minute slot in your calendar on the first working day of each month. Write the five numbers in a simple spreadsheet. After three months, you'll start to see patterns, and you'll have real information when you talk to your web team about what to improve next. The Hyderabad client now sends us her spreadsheet every month with one line of notes. Last month's was "Search down, Instagram up, enquiries same. Should I worry?" (She shouldn't. But that's exactly the kind of question the numbers are for.)
If setting up conversion tracking sounds complicated, ask your developer. It's usually an hour or two of work, and it turns your analytics from a confusing dashboard into something genuinely useful.